
AP Physics 1
Question is looking for the nodes (minima). There are two sources producing identical waves in phase. The waves travel towards the other source, so they are traveling head-on and will overlap one another, resulting in a standing wave.
When the waves have traveled the same distance, they will be in phase (constructive interference), because they started out in phase.
At a point midway between the two speakers, the waves will have traveled same distance and there will be an antinode at that midpoint.
Now look at a diagram of a standing wave.
How far friom an antinode is the closest node?
Answer: One-quarter of a wavelength, on either side of the antinode.
So, find the wavelength:(lambda = v/f). Divide it by 4. Then add that distance to the midpoint, and subtract that distance from the midpoint. Those will be two of your answers.
Next, how far from a node is the next node?
Answer: One-half of a wavelength.
Keep adding/subtracting half a wavelength to those two middle nodes, working your way back toward the speakers in both directions, until you pass the end points (where the speakers are). That is it!
Here is a further explanation:
It's a concept called interference of waves.
Two identical waves start out from two sources. Think of two identical wave crests starting out.
If they were put one on top of the other at the start, you would have a crest on a crest and they would interfere constructively.
But they dont start from same place. But, if they travel the same distance and then overlap each other (one on top of the other), they will be a crest on a crest, which gives constructive interference, which is an anti node in a standing wave.
Now, these are not just crests that are being produced. They are continuous waves of crests and troughs. The trough is one half wavelength from a crest.
If these two waves are traveling different distances to the same point where they overlap, we need to find the difference in the distance traveled by each wave. If it is one half wavelength different, we would find a crest on top of a trough, which gives destructive interference, which is a node.
So in question 4, if the speakers are 1 meter apart, we know that at the exact midpoint between them, each wave would have traveled .5 m from its source,
and there will be a point of constructive interference there (an antinode).
Let's assume each wave has a wavelength of .1 m. At a point .025 meters
(which is 1/4 of a wavelength) to the left of the midpoint, the wave traveling from the left will have gone .475 m (.5 - .025) from the speaker on the left.
The wave coming from the right will travel .525 m to get to that same point.
If we compare the distance each wave traveled to that point (.525 - .475), we find the wave coming from the right traveled .05 m farther than the wave coming from
the left to get to that point where they now overlap and interfere.
What kind of interference will we find there?
Well, .05 m is half a wavelength. If one wave travels half a wavelength more than an identical wave and then overlaps, we will find a crest of one wave on a trough of another, which is destructive interference, which is a node.
So the middle two nodes in my example will be one quarter of a wavelength before the midpoint (at the .475 m mark), and one quarter of a wavelength after the midpoint (at the .525 m mark).
Because consecutive nodes are half a wavelength apart, you simply need to subtract half a wavelength from the node to the left of the midpoint to find the next node to the left (.475 - .05 = .425). So there is another node at .425.
Keep doing that until you go past zero, into negative numbers (.375, .325, .275, .225, .175, .125, .075, .025, -.025). That means you can stop because you are past the speaker on the left.
So the very first node starting from the left speaker would be found at the .025 m mark using my example.
Then there would be a node every .05 m (which is half a wavelength) to the right of that point.
Then start at the node to the right of the midpoint and add one half wavelength to find the next node to the right.
Keep doing that until you pass the speaker on the right. Then you're done.
A question was asked about how temperature affects the speed of a wave in air.
Read p. 428-29 in your text book.
The medium determines the speed of a wave. Air is the medium, but if the temperature changes, the medium just changed.
The relation is given by v = 331 time sqrt(T/273 K). Temperature in that equation must be in Kelvin. To convert Celsius to Kelvin, add 273 to the Celsius temperature. So 0 degrees C = 273 K. 20 degrees C = 293 K.
There is an approximation that will work for temperatures in Celsius: v = 331 + 0.6(T), where T is the temperature in Celsius.
March 18, Question 2:
We know fn = n (v/lamda). So, the next harmonic would be fn + 1. And it would be equal to (n + 1) (v/lamda).
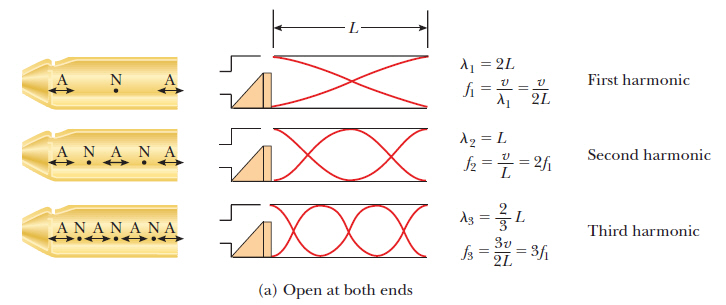
For a string fixed at both ends and for a pipe (air column) open at both ends, the wavelength of the fundamental frequency is 2 times the length of the string or pipe.

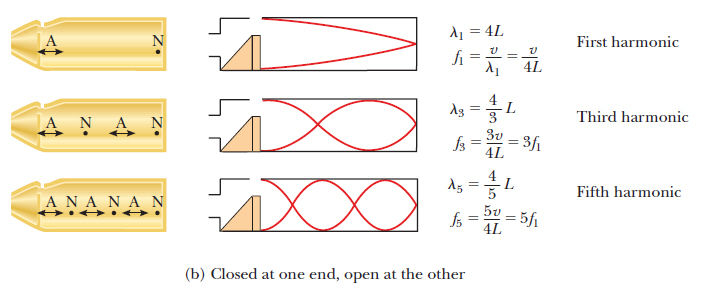
But, for an air column closed at one end, the wavelength of the fundamental frequency is 4 times the length of the pipe:
This question involves a pipe with two open ends, so lamda of the fundamental frequency is 2L.
If we subtract two successive harmonics, the algebraic equation looks like this:
F(n+1)-Fn = (n+1)(v/2L) - (n)(v/2L0 = (1)(v/2L).
In other words, if you know the frequency of two successive harmonics (could be 5th and 6th, or 9th and 10th, doesn't matter which, but they must be successive), when you subtract those frequencies, you get the fundamental frequency.
And if you know the length of the air column, you can find the wavelength of the fundamental frequency.
REMINDER
Be careful with air columns. If they are open at both ends, then the wavelength of the fundamental frequency is 2L, just like in a string.
But if it is closed at one end, the wavelength of the fundamental frequency is 4L, because the wave of the fundamental frequency goes from a node at the closed end to an antinode at the open end, and that distance is just a quarter of a wave.
This question is two open ends, so lambda for f1 is 2L.
March 18, Question 8:
8 is like 3. You have multiple unknowns: D1, D2, and t.
So you need to write 3 equations. Two of the equations are motion equations (speed of sound is constant, so d = vt).
1) D1 = 343t
2) D2 = 343(t +extra time given)
Third equation is Pythagorean Theorem:
3) D2^2 = D1^2 + D^2 (but D is known)
March 20, Graphing Exercise -- Linearization of data in this lab exercise:
Generally, if you are asked to linearize data it is because a straight graph of the data without modification will yield a curve, as in this case.
You need to apply the two step approach to linearizing:
1) Find the physics equation that contains the variables in question. Here, the variables are
speed of the source of the wave (v) and detected frequency. Note that detected frequency is
different than original frequency. Detected frequency changes while original frequency remains constant.
The equation is: (detected frequency) = (original frequency)(speed of wave/(speed of wave -/+ speed of source).
That can be rewritten as (original frequency)(speed of wave)(1/(speed of wave -/+ speed of source).
2) Circle the variables at issue that are in the equation, but you must include at a minimum any
exponents with the variable.
So you would circle detected frequency in one circle, and 1/(speed of wave -/+ speed of source) in the other circle. Whatever is in the circle is how you label the axes of the graph.
You must then recalculate what 1/(speed of wave -/+ speed of source is for each detected frequency.
Plot 1/(speed of wave -/+ speed of source) on the x-axis and detected frequency on the y-axis. That will give you a line.
And the slope should be the original frequency times the speed of the wave.
There are, of course, other ways to linearize. This is but one way.
(Hz) |
(m/s) |
(m/s)^-1 |
You know how to fill in the rest. This shows what points you are plotting on the graph.